New Mexico
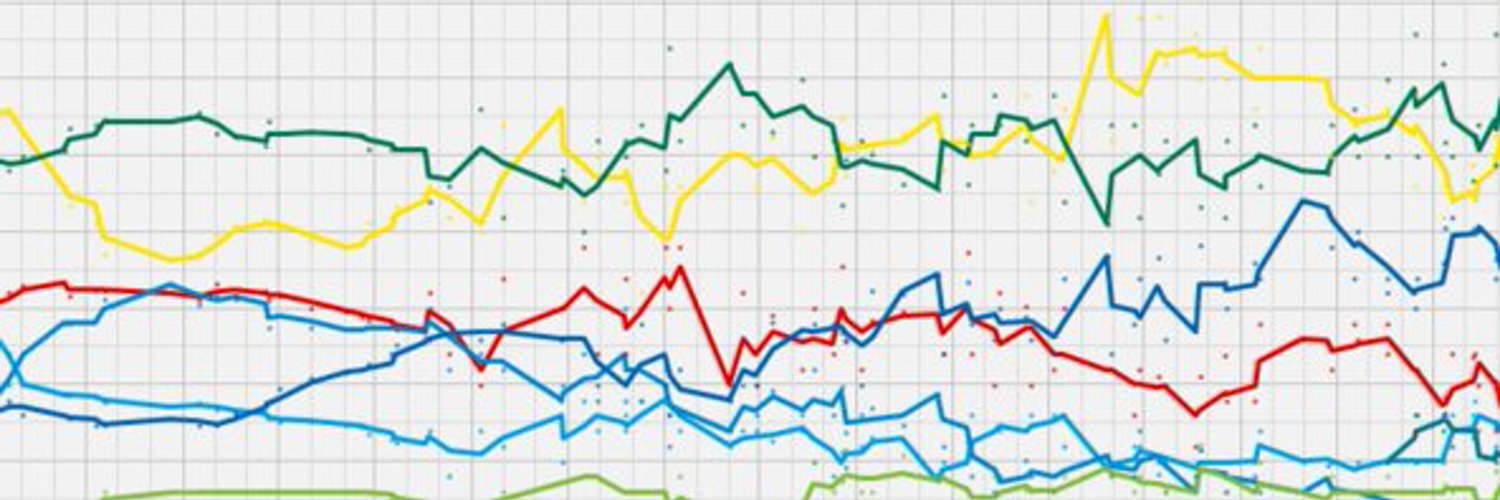
Current Polling Average
Margin:
D+6.0
Final 2024 Election Results
All Polls from 2024 (10)
| Pollster | Date | Sample | Kamala Harris | Donald Trump | Margin |
|---|---|---|---|---|---|
|
KOB-TV/SurveyUSA
LV |
Oct 31 Oct 28 - Oct 31 |
632 ±5.5% |
50.0% | 44.0% | D+6.0 |
|
KOB-TV/SurveyUSA
LV |
Oct 31 Oct 28 - Oct 31 |
632 ±5.5% |
50.0% | 44.0% | D+6.0 |
|
Rasmussen Reports
LV |
Oct 26 Oct 24 - Oct 26 |
749 ±3.0% |
49.0% | 44.0% | D+5.0 |
|
Rasmussen Reports
LV |
Oct 26 Oct 24 - Oct 26 |
749 ±3.0% |
49.0% | 44.0% | D+5.0 |
|
Albuquerque Journal
LV |
Oct 18 Oct 10 - Oct 18 |
1,024 ±3.1% |
50.0% | 41.0% | D+9.0 |
|
Albuquerque Journal
LV |
Oct 18 Oct 10 - Oct 18 |
1,024 ±3.1% |
50.0% | 41.0% | D+9.0 |
|
Rasmussen Reports
LV |
Sep 22 Sep 19 - Sep 22 |
708 ±3.0% |
50.0% | 44.0% | D+6.0 |
|
KOB-TV/SurveyUSA
LV |
Sep 18 Sep 12 - Sep 18 |
619 ±5.4% |
50.0% | 42.0% | D+8.0 |
|
Albuquerque Journal
LV |
Sep 13 Sep 6 - Sep 13 |
532 ±4.2% |
49.0% | 39.0% | D+10.0 |
|
The Hill/Emerson
RV |
Aug 22 Aug 20 - Aug 22 |
965 ±3.1% |
52.0% | 42.0% | D+10.0 |
About This Data
Poll averages are calculated using the most recent 10 days of polling data. All polls are weighted equally in the average. Ratings are assigned based on the polling margin between the two major party candidates.